

Back to Overview


Your Review: Note: HTML is not translated!
Rating: Bad Good
Enter the code in the box below:


Using a Fishbone Diagram to Quantify Contributing Factors
keywords : strategic management, strategy, strategic evaluation, fishbone diagram
Price:$3.00 Incl. VAT
Add to Cart
 Add to Wishlist

keywords : strategic management, strategy, strategic evaluation, fishbone diagram
Price:$3.00 Incl. VAT
Add to Cart
Add to Wishlist
0 reviews |
Write a review
Write a review
Your Name:Your Review: Note: HTML is not translated!
Rating: Bad Good
Enter the code in the box below:
Last Visited products
Hierarchy Diagrams 2.6.300
$2.00
$2.00
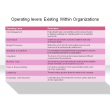
Operating levers Existing Within Organizations
$3.00
$3.00
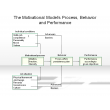
The Motivational Model’s Process, Behavior and Performance
$3.00
$3.00
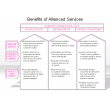
Benefits of Allianced Services
$3.00
$3.00